Already Installed Watch My Domains SED v4?
Here is a basic introduction to the interface to get you started.
![]()
The Domain Table Interface
The domain table interface is the default UI for Watch My Domains SED v4. It is split into three panes and two toolbars.
The left pane houses the category, auto-query and custom-query options.
The right pane is split horizontally into the domain table on top and the details pane at the bottom. The details pane consists of a number of tabbed options that allow you to inspect data corresponding to the domain selected in the top panel.
There are toolbars on the right and top. The top toolbar houses options to switch the display table to different display groups and also to access the other modules like 'Report Viewer' and 'Domain Dashboard'.
The right side toolbar contains options to add and delete domains, configure display groups, create custom columns, do lookups, download or upload data and more.
The Domain Monitor
The domain monitor allows you to see all your domain records as data-cards with the domains that need attention appropriately tagged.
You can scroll through all your domains using the pager toolbar at the bottom, you can also add and delete domains.
You can access the domain monitor from the domain dashboard or the top toolbar in domain table interface. As you can see from the screen shots, the domain monitor also supports different visual themes.

The Domain Dashboard
The domain dashboard provides a quick snapshot summary of your domain records along with links to all the modules in the application.
You can access the domain dashboard at any time by clicking the logo or the first button in the top toolbar in the domain table interface.

The Report Viewer
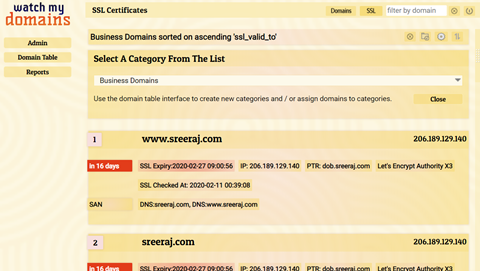
The report viewer (known as subdomain manager in earlier versions) allows you to see all your domains and subdomains in a single place. You can sort, filter, add and delete subdomains from the report viewer.
You can access the report viewer from the domain dashboard or the top toolbar in domain table interface.
You can return to the domain dashboard from the report view by clicking on the logo at top left or from the toolbar button at the top.
Adding Domains
We recommend that you add only a small batch of a few hundred domain names in the beginning so that you can get used to the interface and other functions. This will also help you to configure the interface as required. Once you are comfortable with the user interface you can add more domains.
Retrieving & Viewing Data
Unlike the desktop versions, the server edition performs whois and other lookups in the background through a cron job. After adding the domains you will need to wait a while to see the retrieved data. The lookup queue is processed every minute. You can sort using the 'Primary Whois At' column to see the domains that were recently checked. Use the 'Reload Grid' button at the foot of the domain table to refresh the domain table.
SSH Access on Managed Installations
It is possible to gain SSH access even if you are using the software from one of our managed servers. Simply send us your public SSH key from the email address registered with us.